
Corporate event management brings together objectives, budgeting, suppliers, schedules and participant communication. This guide outlines the decisions needed to plan a business gathering and evaluate it against goals agreed before production begins.
June 2026 Update
Mid-year is one of the busiest periods on the corporate-events calendar, with summer conferences, kick-offs, and incentive programs running in parallel — which makes disciplined process management more important than ever. If you are scoping a Q3 or Q4 event now, a planning runway of roughly three to six months is realistic for mid-sized programs, with larger or multi-day events (and anything involving group travel over 50 people) needing meaningfully longer to secure venues, accommodation, and key suppliers. With demand high across European destinations, lock venue and date first and treat them as the anchor for the rest of the plan. A practical takeaway for this season: front-load your risk assessment and contracting, because the closer you get to peak dates, the less flexibility suppliers have to absorb late changes.
Table of Contents
- Defining Corporate Event Management And Its Scope
- Types Of Corporate Events And Their Purposes
- Core Processes In Corporate Event Management
- Essential Roles And Responsibilities Involved
- Risks, Costs, And Success Factors To Consider
Key Takeaways
| Point | Details |
|---|---|
| Scope of Corporate Event Management | Involves strategic planning, budgeting, logistics, and stakeholder communication to align events with organizational goals. |
| Types of Corporate Events | Include conferences, product launches, and team-building activities, each serving specific business purposes and objectives. |
| Core Processes | Encompass strategic planning, risk assessment, and compliance verification to ensure successful event execution. |
| Essential Roles | Involve a team of specialists including event planners, logistics coordinators, and marketing experts to create impactful experiences. |
Defining Corporate Event Management and Its Scope
Corporate event management represents a strategic discipline focused on designing, planning, and executing professional gatherings that support an organization’s business objectives. According to the Event Management Body of Knowledge, this specialized field encompasses a comprehensive framework of knowledge and skills required to create impactful business events.
Corporate events are structured professional gatherings designed to achieve specific organizational goals. These can include conferences, product launches, team-building retreats, annual meetings, training sessions, and industry networking opportunities. As Cesar Ritz Colleges explains, these events are critical components of a company’s broader business strategy, demanding significant professionalism and strategic expertise.
The scope of corporate event management extends far beyond simple logistics. Professionals in this field must be adept at:
- Strategic planning and alignment with business objectives
- Budgeting and financial management
- Venue selection and design
- Technology and audiovisual integration
- Stakeholder communication
- Risk management and contingency planning
- Cultural sensitivity and international event considerations
Successful corporate event management requires a multidisciplinary approach, blending elements of project management, marketing, communication, and hospitality to create meaningful professional experiences that drive organizational success.
Types of Corporate Events and Their Purposes
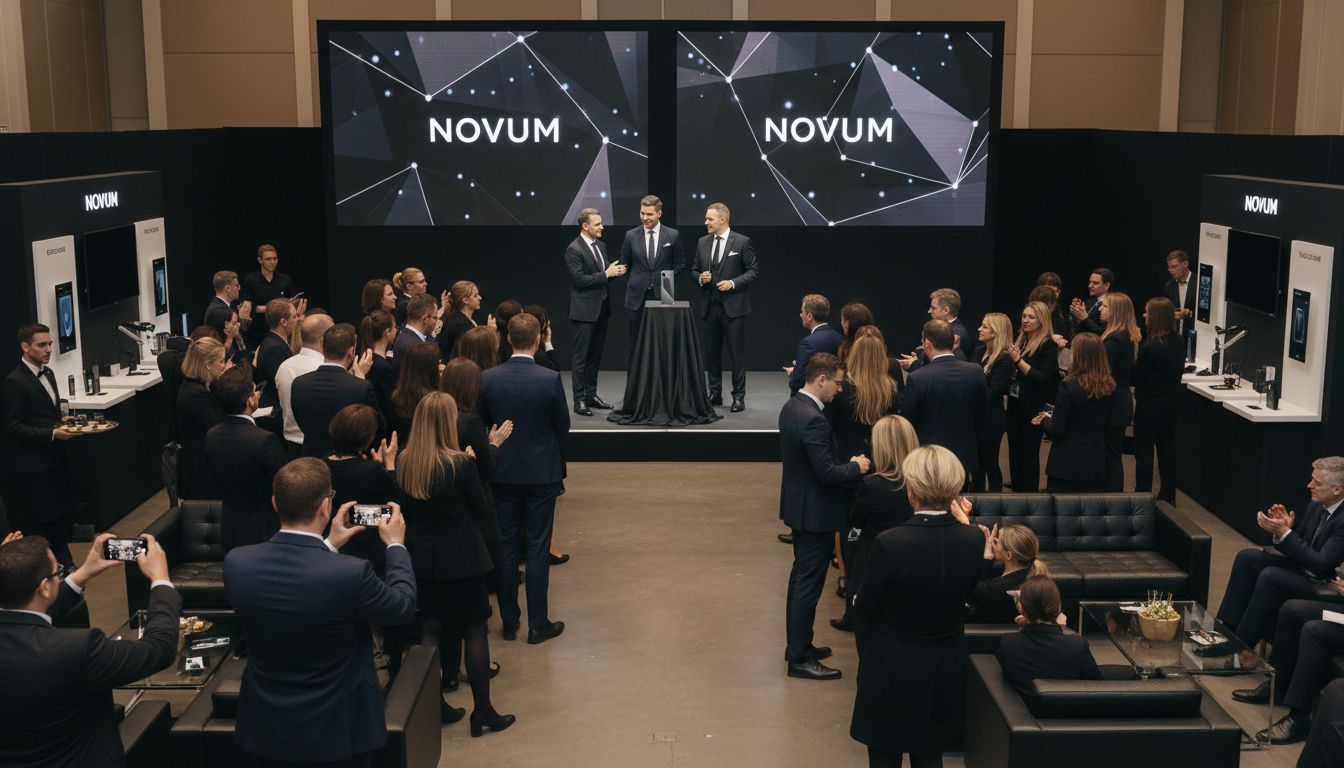
Corporate events are strategic gatherings designed to achieve specific organizational objectives, encompassing a diverse range of professional interactions. According to Teami, these events include various formats such as conferences, product launches, team-building retreats, and corporate celebrations, each serving distinct purposes in the business ecosystem.
Corporate events can be categorized into several primary types, each with unique goals and strategic implications. As Les Roches explains, these event categories typically include:
- Conferences and Seminars: Knowledge sharing, industry insights, and professional networking
- Product Launches: Introducing new products or services to stakeholders, media, and potential customers
- Trade Shows: Industry exhibition and business development opportunities
- Shareholder Meetings: Corporate governance and communication of financial performance
- Team-Building Events: Enhancing internal communication and employee engagement
- Corporate Retreats: Strategic planning, skill development, and organizational alignment
Each event type requires meticulous planning and execution to deliver maximum value. Explore our exclusive events service to see how Uproduction transforms traditional event formats into dynamic, engaging experiences that drive meaningful outcomes.
Here’s a summary of key types of corporate events and their primary objectives:
| Event Type | Main Purpose | Typical Outcomes |
|---|---|---|
| Conferences & Seminars | Knowledge sharing, networking | Industry insights, professional relationships |
| Product Launches | Introduce new products, raise awareness | Market visibility, stakeholder engagement |
| Trade Shows | Industry exhibition, business development | Lead generation, partnerships |
| Shareholder Meetings | Corporate governance, financial communication | Transparency, shareholder trust |
| Team-Building Events | Improve communication, boost morale | Enhanced collaboration, employee engagement |
| Corporate Retreats | Strategic planning, skill development | Organizational alignment, leadership growth |
The primary objectives of these events extend beyond mere gatherings. They serve as powerful platforms for communication, brand reinforcement, employee motivation, and strategic networking. Successful corporate events create opportunities for knowledge transfer, relationship building, and organizational growth, making them critical components of a comprehensive business strategy.
Core Processes in Corporate Event Management
Corporate event management involves a complex series of strategic processes that transform initial concepts into successful professional experiences. According to IED, organizing a successful corporate event requires meticulous planning, sharp attention to detail, and exceptional problem-solving skills across multiple interconnected stages.
Event management processes encompass several critical phases that ensure comprehensive planning and execution. As Les Roches explains, these core processes typically include:
- Strategic Planning: Defining event objectives, target audience, and desired outcomes
- Budget Development: Creating detailed financial frameworks and resource allocation
- Vendor Negotiation: Identifying, selecting, and contracting appropriate service providers
- Logistics Coordination: Managing venue selection, transportation, and technical requirements
- Communication Management: Developing comprehensive communication strategies for stakeholders
- Risk Assessment: Identifying potential challenges and creating contingency plans
- Compliance Verification: Ensuring legal and organizational requirements are met
Successful implementation of these processes requires a holistic approach that balances creativity with strategic precision. See how our business-events team navigates these operational landscapes for clients across Israel, Europe, and beyond.
Ultimately, corporate event management is an intricate dance of strategic planning, creative problem-solving, and precise execution. Each process interconnects to create seamless experiences that not only meet but exceed organizational objectives, transforming simple gatherings into powerful platforms for communication, engagement, and strategic advancement.
Essential Roles and Responsibilities Involved
Corporate event management is a complex ecosystem of specialized professionals working collaboratively to deliver exceptional experiences. These professionals have multifaceted responsibilities that span strategic planning, financial management, and operational execution.
Event management teams typically comprise several key roles, each with distinct yet interconnected responsibilities:
- Corporate Event Planner: Overall strategic orchestration and vision
- Logistics Coordinator: Transportation, venue management, and technical infrastructure
- Marketing Specialist: Event promotion, audience engagement, and communication strategies
- Financial Manager: Budget development, vendor negotiations, and fiscal tracking
- Technical Production Specialist: Audiovisual setup, technology integration, and digital experience design
- Risk Management Expert: Compliance verification, contingency planning, and safety protocols
- Creative Director: Aesthetic design, thematic development, and experiential storytelling
Each role requires specialized skills and a deep understanding of how their specific responsibilities contribute to the event’s broader objectives.
Successful corporate event management demands more than individual expertise — it requires seamless team integration, clear communication, and a shared commitment to delivering exceptional outcomes. These professionals transform complex logistical challenges into smooth, impactful experiences that align perfectly with organizational goals and stakeholder expectations.
Risks, Costs, and Success Factors to Consider
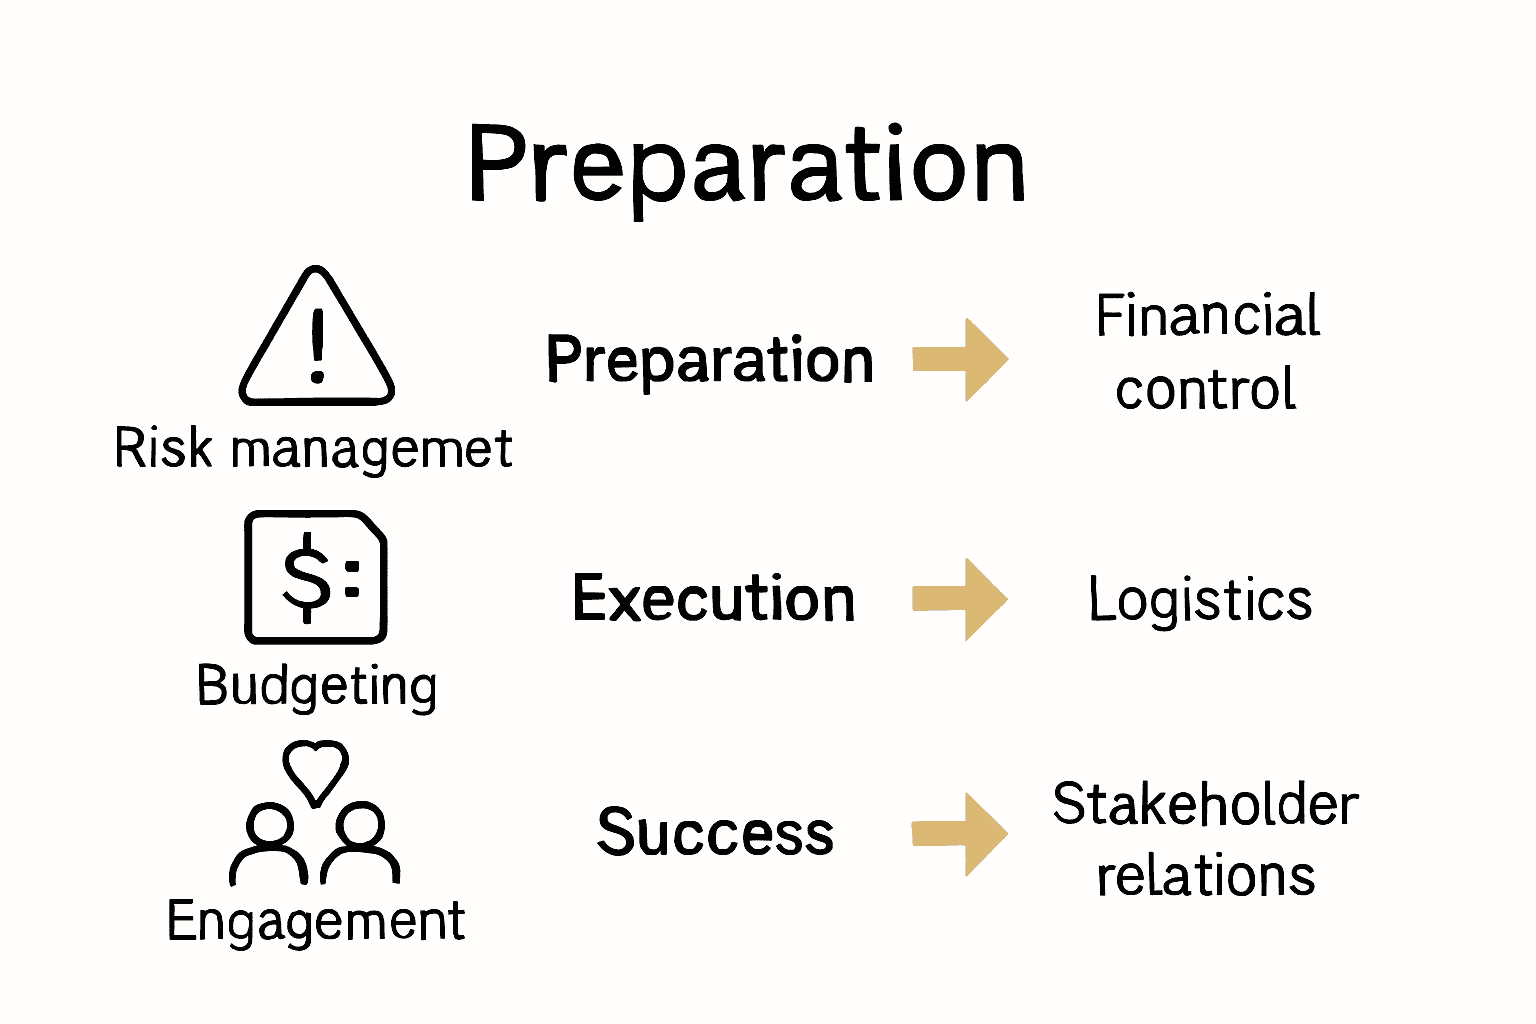
Corporate event management requires a sophisticated approach to anticipating and mitigating potential challenges while maintaining financial efficiency. Effective management involves developing strategic approaches to maximize attendance, minimize costs, and ensure comprehensive compliance with legal requirements.
Critical risk management in corporate events encompasses several key dimensions:
- Financial Risks: Budget overruns, unexpected expenses, and revenue unpredictability
- Logistical Challenges: Venue complications, technical infrastructure failures
- Attendance Uncertainties: Registration fluctuations, last-minute cancellations
- Compliance Issues: Legal and regulatory adherence
- Reputation Management: Maintaining brand image and stakeholder expectations
- Technology Integration: Potential digital infrastructure failures
- External Contingencies: Unexpected market or environmental disruptions
Successful event planning demands proactive risk mitigation strategies — converting each of these dimensions from a hidden cost into a managed line in the plan.
Ultimately, success in corporate event management is measured by the ability to transform potential risks into strategic opportunities. By implementing comprehensive planning, maintaining financial discipline, and creating adaptable frameworks, organizations can convert complex logistical challenges into powerful platforms for communication, engagement, and strategic advancement.
Elevate Your Corporate Events with Expert Management Solutions
Corporate event management involves careful strategic planning, seamless logistics, and proactive risk management to transform your company’s vision into a memorable experience. If you recognize the challenges of aligning every detail — from budgeting to technology integration — while maintaining creative impact and stakeholder engagement, you are not alone. The points above highlight the importance of multidisciplinary expertise and precise execution for successful professional gatherings.
At Uproduction, we specialize in delivering tailored corporate events and international conferences that meet these challenges head-on, with innovation and high-quality execution. Our team ensures every element — from venue selection to audiovisual design — aligns with your business objectives. Explore how our business-events service and pleasure-travel programs can turn your next event into a strategic success.
Ready to transform complex event logistics into impactful experiences that inspire and connect? Get in touch for personalized solutions at any scale, in any industry.
Frequently Asked Questions
What is corporate event management?
Corporate event management refers to the discipline of planning, designing, and executing professional gatherings that align with an organization’s business objectives — conferences, product launches, team-building events, and more.
What types of corporate events are there?
Corporate events generally include conferences, product launches, trade shows, shareholder meetings, team-building retreats, and corporate celebrations, each serving different purposes within a business’s strategy.
What are the core processes involved in corporate event management?
The core processes in corporate event management include strategic planning, budget development, vendor negotiation, logistics coordination, communication management, risk assessment, and compliance verification.
What roles are typically involved in a corporate event management team?
A corporate event management team usually consists of a corporate event planner, logistics coordinator, marketing specialist, financial manager, technical production specialist, risk management expert, and creative director — each contributing specialized skills to ensure successful event execution.